Slide 11
How oral rehydration worksFigure 4
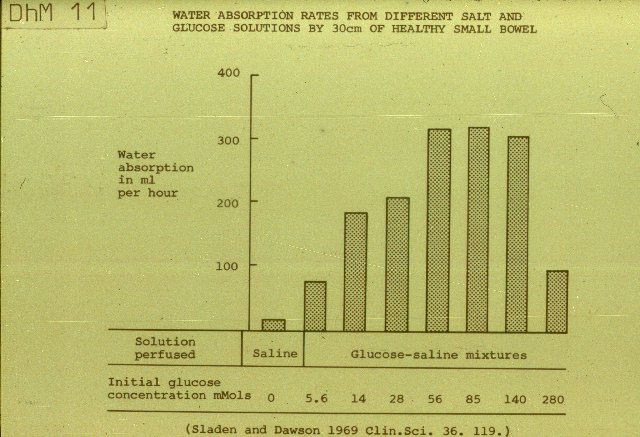
- Water absorption rates from different salt
and glucose solutions by 30cm of healthy small bowel
This bar graph shows some of the experimental evidence for the
conclusions given in="diarrhoea-management-10.htm" target="_blank"> Slide
10. The graph shows quantitatively the great effect
of glucose on absorption from the bowel. The scale on the left shows how much
water is absorbed. The scale along the bottom of the graph shows how much
glucose is added to the saline. (Saline is simply water containing salt.) The height of each bar represents how much fluid
is absorbed per how with that particular concentration of glucose. With saline alone, not much water is
absorbed. This is shown by the height of the small bar on the left. As the amount of glucose is increased step
by step towards the right, the amount of water absorbed also increases greatly. This is
shown by the longer bars. Above a certain point, when there is very much glucose,
be amount of water absorbed begins to fall. With the best proportion of salt and glucose, the bowel can
absorb about 25 times as much water as from saline alone. This is the physiological mechanism
which makes oral rehydration work. (Reference
3)