Slide 22
Diarrhoea and food
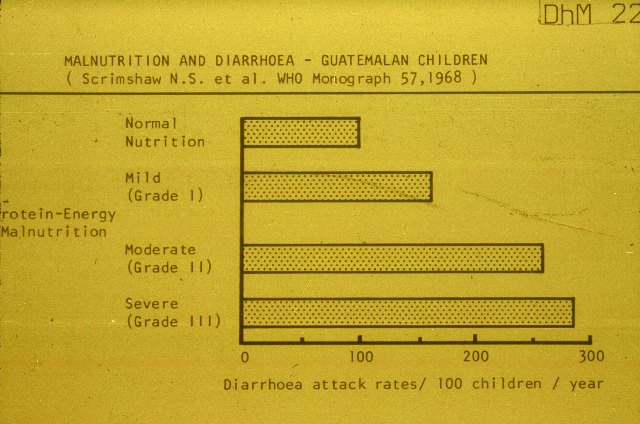
Figure 9 - Malnutrition and Diarrhoea Guatemalan Children
Teacher's Note
You may wish to omit this slide for students with less than four years of
secondary education. Spend more time on="diarrhoea-management-21.htm" target="_blank"> Slides 21 and
23. |
This bar-graph shows the relationship between malnutrition and diarrhoea in children
from Guatemala in Central America. Each bar is for protein-energy malnutrition
of a different grade or severity. Severe or grade III malnutrition is at the
bottom. The moderate, grade II, and mild, grade I, with normal malnutrition at
the top. The scale along the bottom shows the number of attacks of diarrhoea per
year in a hundred children with the grade of malnutrition. So, a longer bar
means more diarrhoea.
Q. So what does the graph tell you about the effect of malnutrition on the number
of attack of diarrhoea?
A. Malnourished children have more diarrhoea than well nourished children. The
'diarrhoea bars' for children with grade II and III malnutrition are more than
twice as long as the top bar for children with normal nutrition. (Reference
3)